
Megatrend 1: Falling Solar and Wind Costs Are Reshaping Power Markets and Silver Demand
Solar and wind are now the world’s cheapest[i] source of new power. Following a massive capex bubble in China that led to overcapacity in both industries, the upfront cost of building solar and wind farms has collapsed over the last five years. Because they burn no fuel, it costs next to zero dollars to produce a marginal kilowatt-hour (kWh) of electricity.
Many countries around the world can now install solar and onshore wind farms to produce electricity at a Levelized Cost of Electricity (LCOE) of US$0.02-0.04/kWh[ii],[iii], which is well below that of gas (US$0.06[iv]), nuclear (US$0.08[v]), and coal (US$0.13[vi]).
Given their superior economics, solar and wind already stand to displace most conventional power generation. However, the Artificial Intelligence (AI) boom also massively increased total electricity demand. The immediate need for new power generation of all sources has led to gas turbine order lead times stretching beyond 5 years[vii], meaning gas power cannot grow beyond current locked-in plans.
The only scalable near-term solution? Solar, wind, and batteries.
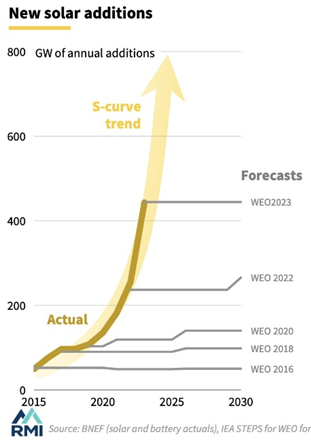
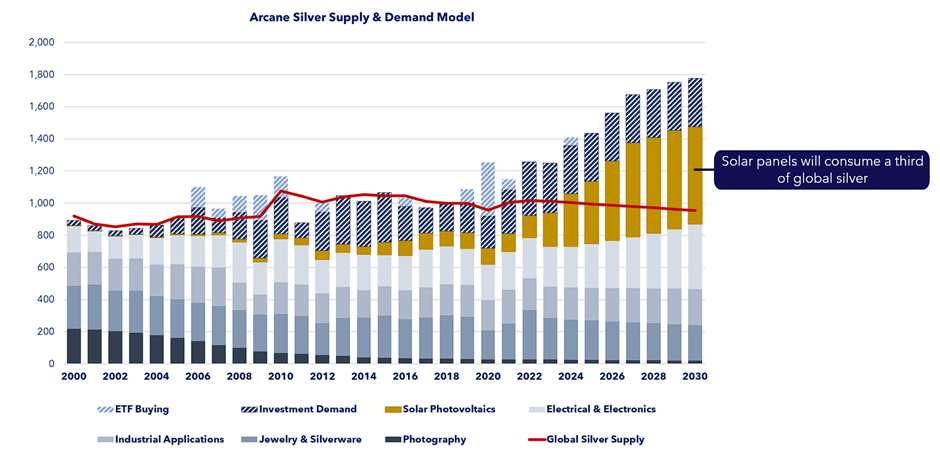
The exponential growth of solar installations, far exceeding earlier World Energy Outlook (WEO) forecasts, has already disrupted one major metals market – silver. The solar industry went from nearly no representation in the silver market in 2000, to consuming 17%[viii] of all world silver supply in 2025, pushing the silver market into its fifth year of deficit.
As a result, after years of deficit consuming above-ground inventory, silver’s price surged from the $15-20/oz range prevalent a decade ago, to the $60/oz range today.
We expect solar installations to grow from 650GW last year to 1,000GW per year by the end of this decade, and if the silver load per panel fails to meaningfully fall, this one sector could consume up to a third of world silver[ix]. Thrifting and substitutes will almost certainly happen, but we believe the broad deficit is likely to persist. On top of this, AI and electronics will also start consuming more silver.
Megatrend 2: Rapidly Falling Battery Costs and the Rise of LFP Are Transforming Lithium Demand
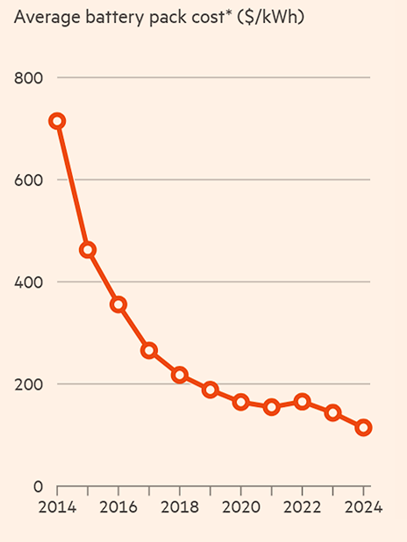
[x]In 2013, Elon Musk popularized the “Gigafactory” term, referring to a battery factory with an annual capacity of 1GWh. Today, Chinese battery plants come at scales of 10GWh and even 100GWh[xi]. After a decade of consistent process improvements and scale gains, battery pack prices have exponentially declined from >$700/kWh to around $100/kWh.
Beyond scale, battery chemistry also played a part. In the early years, batteries with a Lithium-Nickel-Manganese-Cobalt (NMC) cathode were the dominant chemistry. However, since 2020, Lithium-Iron-Phosphate (LFP) started becoming a serious contender as engineers improved its energy density. Though NMC still holds an edge today in pure energy density, LFP accounted for over 55% of EV batteries deployed globally in 2025 and over 90% of stationary battery-storage installations[xii].
This is not to say that NMC batteries are dead. They remain dominant in high-performance vehicles. Many solid-state battery designs under development use nickel-rich cathodes, although the eventual chemistry mix remains uncertain. Solid state batteries may enable battery-powered flight (from flying taxis to airplanes), opening up yet another massive market for disruption. Nickel demand could rise when solid state batteries reach commercial scale.
As overall battery costs declined, demand surged. The global lithium market was a mere ~160 kilotons (kt) Lithium Carbonate Equivalent (LCE) in 2014, with most of the lithium going towards industrial uses like ceramics and glass and less than one-third used in batteries[xiii]. In 2025, the market had grown nearly ten times the size to 1,500kt LCE, with batteries accounting for over four-fifths of demand[xiv].
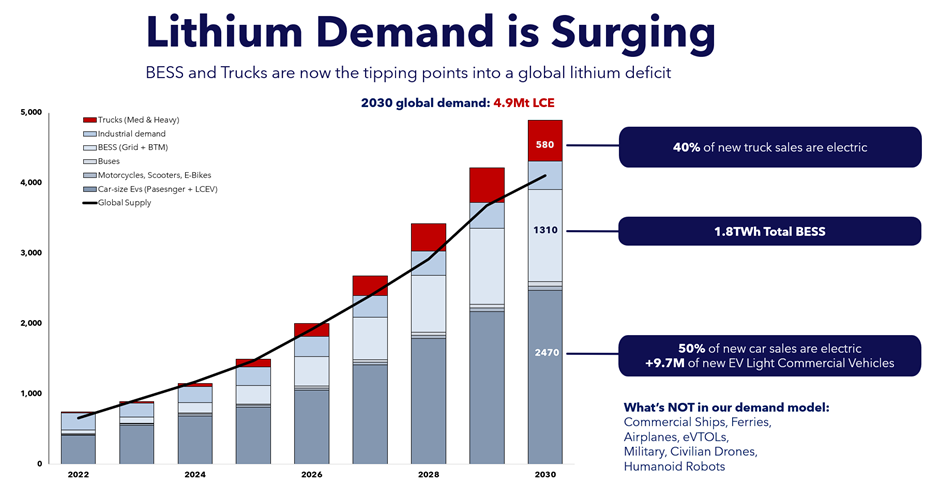
Our proprietary supply-demand model forecasts lithium demand to grow towards 4.9Mt LCE in 2030, entering a deficit from 2026 as mine supply fails to catch up.
This second megatrend of declining battery costs is the key enabler of the next three megatrends.
Megatrend 3: Grid Storage (BESS) is becoming a key pillar of major economies’ energy generation
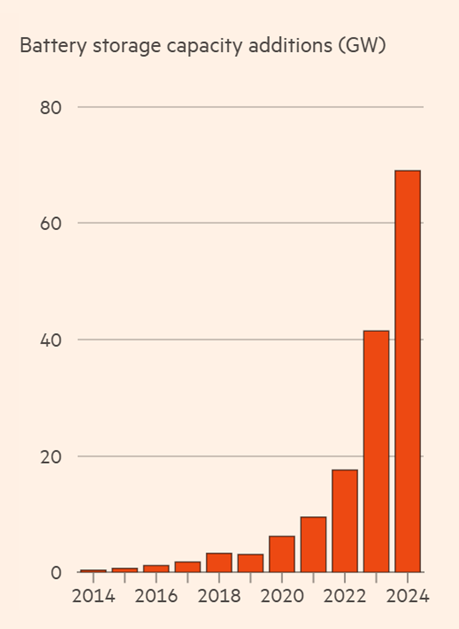
[xv]What happens when we combine a surge in electricity demand from AI, rock-bottom solar pricing, and exponentially declining battery costs? The combination of the first two megatrends has naturally led to the third – the rise of Battery Energy Storage Systems (BESS), a.k.a. grid storage.
The premise is simple. Stuff as many batteries as physically possible into a 20-foot shipping container and hook it up next to a solar farm. Do this for 20 to 100 containers. When wholesale electricity prices go to nearly zero or even negative at noon[xvi] (as is the case in many economies today given the massive solar build-out), charge the batteries. When grid demand peaks in the evening and wholesale prices are highest, discharge the batteries and earn the margin.
The falling costs of batteries and high peak electricity costs have resulted in BESS enjoying payback periods of around 5 years in many markets, and even as low as 3 years in some regions[xvii]. Anecdotally, in China, some commercial BESS enjoy 1.7 years’ payback using second-tier manufacturers’ lower-cost batteries. The high return on investment on this business model has attracted companies and capital, catapulting this segment into an exponential growth curve.
In 2025, over 500GWh[xviii] of BESS cells were shipped. This year in 2026, we are on track for 900GWh[xix] of shipments, sustaining a growth rate of over 50%. We calculate that a 900GWh production rate would consume ~600kt LCE, or about 30% of the global lithium supply this year.
We continue to see huge growth in the BESS segment as increased electricity demand from AI and favourable economics combine. Storage durations are also lengthening. The IEA estimates the average duration of projects commissioned in 2025 at around three hours, with a growing number of four-hour-or-longer systems (e.g. a 1GWh system supplying 4 hours of 250MW). If we take the current rate of solar installations at around 600GW per year, multiply that by 4 hours assuming the full daily generation capacity is load-shifted to the evening hours, the BESS market could easily reach 2.4TWh annually. We model for a 1.8TWh BESS market by 2030 with the expectation that this figure is likely on the low end of the true outcome range.
BESS is a key pillar of demand, accounting for a quarter of our 2030 Lithium demand forecast.
Megatrend 4: Electric Vehicles and Trucks are all going electric, faster than most people think.
The second megatrend of rapidly-declining battery costs is allowing electric vehicles to approach and finally meet cost parity with petrol/diesel vehicles[xx]. Consumers and businesses are already aware of the other benefits of electric vehicles: Much lower cost of operation, lower maintenance cost, faster acceleration, etc. Once cost parity is achieved, what we see as the second-last barrier to rapid adoption falls.
What is the final barrier? Charging anxiety. To date, many countries have been stuck in a Catch-22 situation: drivers still feel that charging infrastructure remains under-developed and hold back on switching to EVs, but businesses have been unwilling to massively invest in charging infrastructure as EV sales still trail petrol/diesel cars. We believe that once EVs become cheaper than petrol/diesel cars, this vicious cycle will be broken. Drivers will not want to lock in higher costs in all respects, businesses will rationally expect this behaviour, and work faster to invest in building out the charging infrastructure.
The EV sales figures have been strongly encouraging. Global plug-in EV sales saw a 30% market share in June 2026, and 24% YTD. The world’s largest car market, China, saw 54% of all sales being electric in the first half. Europe’s figure was 37%. The USA is still lagging far behind at only 7%.
Another major trend is the electrification of the logistics industry, especially in heavy (Class 8) and medium trucks (Class 4-7). Here, China is showing the rest of the world what can be – heavy trucks sales grew 182%[xxi] last year. Altogether, heavy and medium trucks made up 27% of all new truck sales in China, more than doubling the penetration rate in a single year. Policymakers in China broke the Catch-22 here early, by subsidizing the buildout of truck charging infrastructure well before EV truck sales surged, enabling that surge itself.
Why do we say that EVs and Trucks will grow faster than people think? Most analysts are still forecasting a global EV penetration rate of 25%[xxii]-45%[xxiii] in 2030. We see this figure exceeding 50% and potentially approaching 60%!
First, when a disruptive technology hits the tipping point, the adoption follows an S-curve pattern. Norway went from 20% in 2017, to 42% in 2019, to 96% in 2025. We are seeing competitively-priced EV exports from China surging >100% YoY, enabling many other countries to jump up this S-curve.
Second, the US-Iran war has opened the eyes of both individual drivers and governments to the fragility of relying on petrol and diesel. Petrol/diesel prices surged 33-50% in many countries, and some areas experienced shortages. It took the cumulative release of strategic reserves across multiple countries to keep a lid on fuel prices, and these reserves are not infinite. Now that there exists the ready availability of home-charging using electricity off cheap solar panels on the roof, drivers are becoming more ready to take a chance on the unfamiliar new technology, versus the certainty of high fuel prices.
Third, there is a flywheel effect in real businesses that forecasters seem to be ignoring. For the last century, car dealerships were built on this economic feedback loop: petrol/diesel cars required frequent maintenance (oil changes, spark plugs, belt replacements, transmission flushes, emissions systems) that generated high margins, often accounting for up to 50% of a dealership’s gross profit. The transition to EVs has broken this flywheel –
1) no more oil changes, spark plugs, fuel injectors, etc.;
2) software and over-the-air updates have reduced the need to physically visit the dealership;
3) more modular electric powertrain components have reduced the need for specialized-parts stockists; and
4) direct-to-consumer sales by some carmakers cutting out the dealerships.
The negative-flywheel effect for petrol/diesel car dealerships is being compounded with a positive effect for EVs as adoption rates grow and fixed costs are spread over a larger number of EV units sold.
Taken together, these mean that the EV adoption rate should be accelerating in the next few years, rather than decelerating as many analysts are imputing into their models.
Megatrend 5: The Electrification of Everything aligns with national strategies to reduce oil and gas reliance, boosting copper demand
At its very core, burning any sort of fuel to generate motion is incredibly inefficient. In internal combustion vehicles, much of the chemical energy in the fuel is lost to heat and sound, such that less than 20% of the energy goes towards the kinetic motion of the vehicle. Not only is this incredibly wasteful, at the national level, it turns oil-resource-poor countries into huge net importers and strategically reliant on a few narrow trade routes (Straits of Hormuz, Malacca, Panama Canal, Red Sea, etc.).
The “Electrification of Everything” represents a foundational shift happening today in how human civilization generates, distributes, and consumes power. At its core, this means replacing direct fossil-fuel combustion with electricity. Emissions and energy-security benefits increase as the electricity system itself becomes cleaner and less dependent on imported fossil fuels.
In transportation and mobility, passenger EVs are supplanting traditional internal combustion automobiles across major global markets, with countries like Norway at >90% and Denmark now at >80% new sales being electric. Beyond personal vehicles, the transition is expanding into commercial delivery fleets, municipal buses, two- and three-wheel bikes, and increasingly regional rail and short-haul maritime shipping.
Within residential and commercial buildings, the electrification theme focuses on decarbonizing space heating, water heating, and daily cooking. Modern heat pumps are replacing fossil gas and oil furnaces, delivering up to three to four times the efficiency of standard combustion units while providing dual heating and cooling functions. Simultaneously, high-efficiency induction cooktops, electric water heaters, and integrated smart-home automation allow structures to shed natural gas hookups entirely. When paired with rooftop solar arrays and residential energy storage, buildings transform from passive power consumers into active energy nodes capable of balancing local microgrids.
Across heavy industry, electrification is fundamentally altering manufacturing. Industrial processes that historically depended on coal or natural gas combustion are adopting electro-thermal technologies, such as electric arc furnaces for steel production. These use massive graphite electrodes (three storeys high and weighing 15-30 tons) which need to be segmentally replaced during operations.
Throughout history, copper has been a key element in human civilization. In more recent history, since the Industrial Age and the discovery of electricity, the copper use per person has steadily increased. We expect electrification, grid investment and data-centre growth to support continued growth in copper demand.
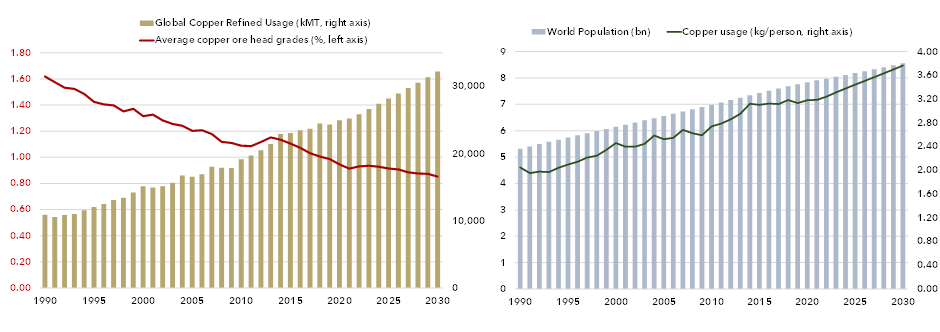
Taken together, these megatrends are contributing to a massive surge in demand for the metals required in the energy transition – Lithium, Silver, Copper, Graphite, Nickel.
[i] https://www.iea.org/reports/world-energy-outlook-2020
[ii] https://www.irena.org/Publications/2024/Sep/Renewable-Power-Generation-Costs-in-2023
[iii] https://www.eia.gov/outlooks/aeo/electricity_generation/pdf/AEO2025_LCOE_report.pdf
[iv] Ibid
[v] Ibid
[vi] Ibid
[vii] https://www.utilitydive.com/news/5-year-waits-and-rising-costs-how-demand-is-redefining-the-gas-turbine-mar/813385/
[viii] The Silver Institute, World Silver Survey 2026
[ix] Historical supply and demand data from World Silver Survey, forecasts by Arcane Capital
[x] Battery GW Additions chart: Source: Financial Times, Ember, BNEF, IEA
[xi] CAT’s Yibin Production Base. 100GWh. https://www.youtube.com/watch?v=hmhHPvDErhM
[xii] https://www.iea.org/reports/global-ev-outlook-2026/electric-vehicle-batteries
[xiii] US Geological Survey: https://d9-wret.s3-us-west-2.amazonaws.com/assets/palladium/production/mineral-pubs/lithium/mcs-2015-lithi.pdf
[xiv] https://www.mordorintelligence.com/industry-reports/lithium-market
[xv] Battery Storage Additions chart: Source: Financial Times, Ember, BNEF, IEA
[xvi] https://www.iea.org/reports/electricity-2025/prices
[xvii] https://anengjipower.com/how-much-does-solar-battery-storage-cost-in-2026-a-complete-roi-guide/
[xviii] https://www.infolink-group.com/energy-article/energy-storage-topic-global-battery-shipment-ranking-2025
[xix] https://www.energytrend.com/news/20260525-51447.html
[xx] https://www.iea.org/reports/global-ev-outlook-2025/trends-in-electric-car-affordability
[xxi] https://www.electrive.com/2026/01/23/year-end-surge-electric-trucks-outsell-diesel-for-the-first-time-in-china/
[xxii] https://www.rosefieldenergytech.com/news/goldman-sachs-updates-its-ev-market-prediction%2C-predicting-an-increase-in-hybrids
[xxiii] https://www.mckinsey.com/features/mckinsey-center-for-future-mobility/our-insights/electric-vehicles-whats-ahead
Leave a Reply